Dashboard
Dashboard is used to summarize important information on the website. Everything will be displayed on the first page when entering the website’s backend system with information arranged as follows;
- To do List
- Number of sales
- Number of customers
- Best-selling products and best-selling categories
- Website page visits
- Number of users
- Latest message
- Latest News Features and Blog Articles
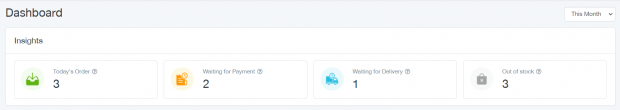
1) To-do List
The section that shows the status of all orders that need to be fulfilled is: Number of orders today / Number of orders awaiting payment / Number of orders waiting for delivery and the number of products that are out of stock.
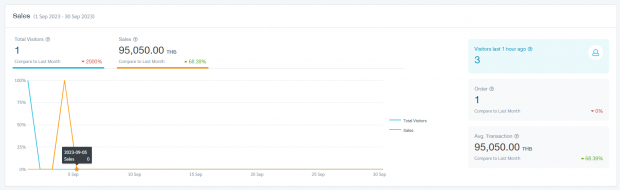
2) Number of sales
It shows a graph of the total number of website visitors and the number of sales in a period of 1 month, along with the growth rate compared to the previous month by the side of the graph. It will show the number of active website visitors / number of orders. and average sales per order so that website owners can view relevant sales data.
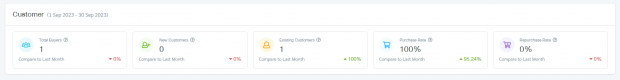
3) Number of customers
It shows the number of customers generated in the last month and the rate compared to the previous month. It shows information on the total number of buyers / number of new customers who place orders / number of existing customers who place orders / product purchase rate and the rate of repeat purchases.
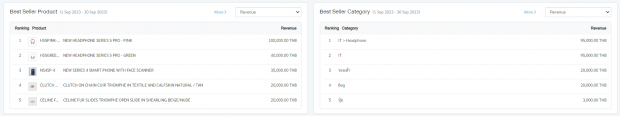
4) Best-selling products and best-selling categories
The system will display information on best-selling products. and best-selling product categories, in which both parts of the system will rank the products, and the top 5 selling products are displayed. Users can sort by income or number of products in the upper right corner of each section.
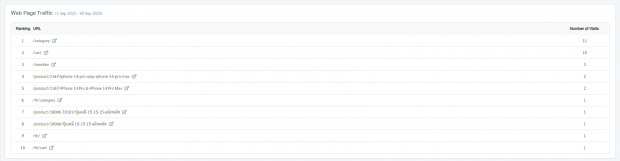
5) Website page visits
It shows visits to the website page. The system will display the top 10 most-visited website URL pages along with the number of times visited in a period of 1 month.
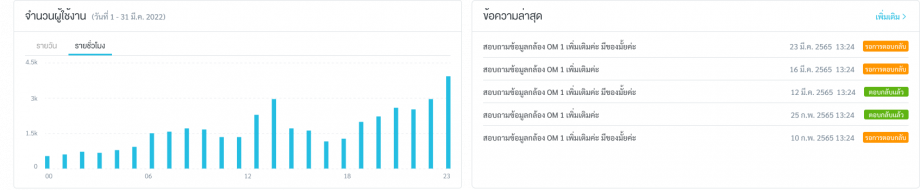
6) Number of users and latest message
On the left side of the graph is a bar graph showing the number of visitors to the site, which is a new section of data that we’ve added, where site owners can choose to view it on a daily or hourly basis. On the right side of the graph are the most recent posts, and the status bar for responses is clearly colored, so you can click on the “More” button to see the total number of posts.
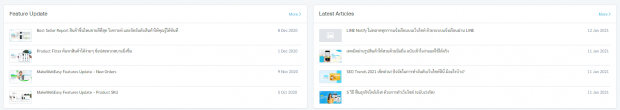
7) Latest News Features and Blog Articles
It’s a MakeWebEasy Feature Update showcase to let customers know about the new features we’ve updated, along with the latest articles from the MakeWebEasy Blog, which are all about websites and online marketing.